Histogram
A histogram is a bar graph in which the horizontal scale represents classes of data values and the vertical scale represents frequencies.
- Triola (2011).
Example
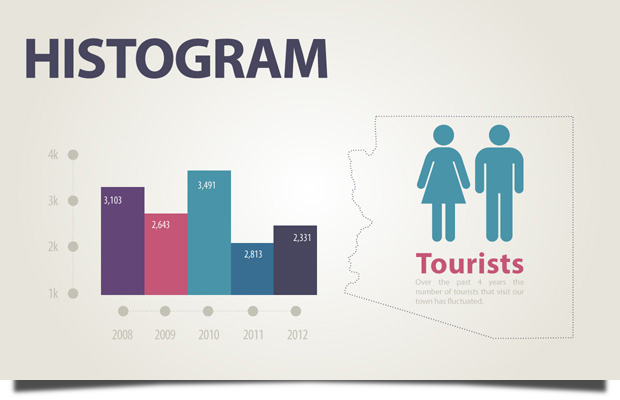
This example shows a bar graph on how many tourists visited Arizona. The vertical scale represents frequency (thousands) and the horizontal scale represents the classes (years). This is just one example of a histogram.
Related Terms
Single Blind
powered by | Academic Web Services
© all rights reserved